The budget supermarket increased spend by 36% year on year to £6.5m for the four weeks ending 8 December, as Tesco, Sainsbury’s, Asda and Morrisons all reined in spending.
Tesco is still the biggest spender in terms of TV and press advertising having spent £11.8m, just ahead of Asda with its spend of £11.2m, while Sainsbury’s and Morrisons spent £7.3m and £7.1m respectively.
Figures from Nielsen show sales are weakening in the lead up to Christmas with Nielsen attributing the slowdown to the weakness in sales of general merchandise products including electronic devices, toys, clothing and home furnishings.
Sales value growth for the four-weeks ending 8 December increased 1.3% year on year, compared to growth of 2.0% for the four week period ending 10 November.
Volume sales declined by 0.5% year on year for the month ending 8 December, after increasing 0.8% year on year for the previous four week period.
Mike Watkins, head of retailer insight at Nielsen UK, believes shoppers are delaying the big shopping trips until the final week before Christmas.
He said: "Because shoppers are planning visits to take advantage of the many offers available this year we, therefore, expect continued use of media spend across all channels in the next few days to encourage them into store and to buy any remaining indulgencies at the same time.
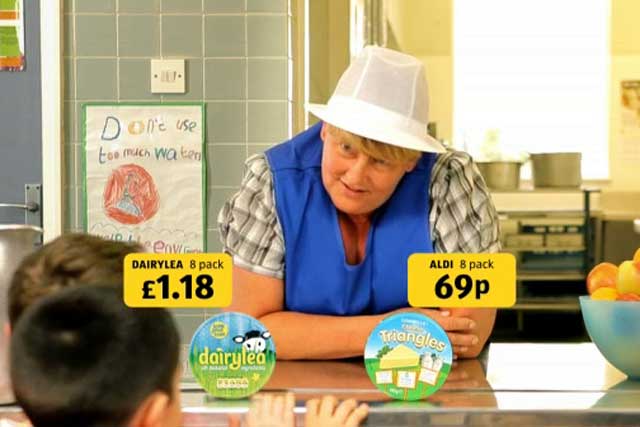
"With Aldi and Lidl also promoting premium food and drink in a big way and targeting more affluent shoppers this Christmas, there is still a lot to play for this weekend."
The latest figures appear to show Tesco is turning around its fortunes after seeing its value sales increase by 2.5% for the 12 weeks to 8 December, while Morrisons was the only major supermarket to see a decline with a 0.9% decrease in value sales.
Watkins has attributed Tesco’s improved performance to its voucher and couponing strategy, in favour of its "big price drop" campaign.
Tesco’s reduction in TV and print spend comes as digital becomes an increasing focus for the brand, which is being supported by .
| 12-weekly % share of grocery market spend by retailer and value sales % change | |||||||||||||||||||||||||||||||||||||||||||||||||
|---|---|---|---|---|---|---|---|---|---|---|---|---|---|---|---|---|---|---|---|---|---|---|---|---|---|---|---|---|---|---|---|---|---|---|---|---|---|---|---|---|---|---|---|---|---|---|---|---|---|
| % Share, 12 wks to 8 Dec 12 | % Share, 12 wks to 10 Dec 11 | % Sales Change v Same, 12 wks year ago | |||||||||||||||||||||||||||||||||||||||||||||||
| Tesco | 28.7% | 28.9% | 2.5% | ||||||||||||||||||||||||||||||||||||||||||||||
| Asda | 16.5% | 16.8% | 1.4% | ||||||||||||||||||||||||||||||||||||||||||||||
| Sainsbury's | 15.9% | 15.9% | 3.4% | ||||||||||||||||||||||||||||||||||||||||||||||
| Morrisons | 10.9% | 11.4% | -0.9% | ||||||||||||||||||||||||||||||||||||||||||||||
| Co-operative | 6.8% | 6.9% | 1.4% | ||||||||||||||||||||||||||||||||||||||||||||||
| Waitrose | 4.2% | 4.0% | 8.5% | ||||||||||||||||||||||||||||||||||||||||||||||
| Marks & Spencer | 3.5% | 3.6% | 1.3% | ||||||||||||||||||||||||||||||||||||||||||||||
| Aldi | 2.9% | 2.1% | 43.6% | ||||||||||||||||||||||||||||||||||||||||||||||
| Lidl | 2.1% | 2.0% | 10.1% | ||||||||||||||||||||||||||||||||||||||||||||||
| Iceland | 2.0% | 1.9% | 4.4% | ||||||||||||||||||||||||||||||||||||||||||||||
The figures in this table are based on 12-week sales through to 8 Dec 2012 compared with the same 12-week period in 2011. Source: Nielsen Total Till, Nielson Homescan

.jpg)
.jpeg)